#SmartIndustry
11 December 2025
OEE (Overall Equipment Effectiveness) : definition and optimization
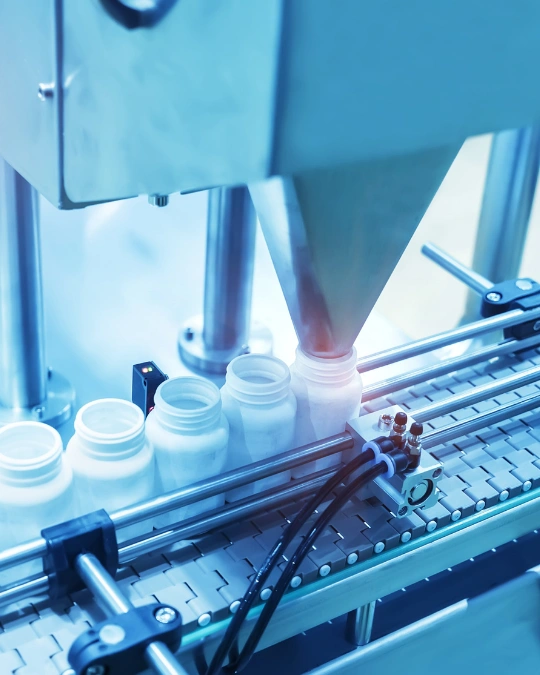
In industrial environments, the actual performance of equipment rarely matches its theoretical potential. Unplanned downtime, reduced operating speeds and production defects all contribute to a significant loss of efficiency.
These gaps are not always immediately visible. They tend to accumulate over time, across production cycles, ultimately impacting the overall profitability of industrial operations.
This is precisely why OEE (Overall Equipment Effectiveness) has become a key performance indicator. It provides a structured way to measure the real efficiency of a machine or production line by combining availability, performance and quality.
However, in practice, OEE is still too often used as a simple monitoring metric. Without detailed analysis and reliable data, it remains a descriptive figure rather than a true operational lever.
Understanding what OEE really measures, how to interpret it and how to act on it is essential to turn it into a powerful tool for industrial performance management.
OEE definition : measuring real performance
OEE is based on a simple principle: measuring what is actually produced under real operating conditions.
It combines three complementary dimensions.
Availability reflects the time during which equipment is actually running. It is directly impacted by breakdowns, unplanned stops and maintenance operations.
Performance measures the actual production rate compared to the theoretical one. A machine may run continuously while still producing less than expected due to micro-stops or slowdowns.
Quality accounts for the proportion of compliant products. Scrap and rework reduce useful output, even when gross production remains high.
The strength of OEE lies in its ability to provide a comprehensive view of performance by integrating these three dimensions and, therefore, all sources of loss.
OEE formula and result interpretation
OEE = Availability × Performance × Quality
This formula implies a cumulative effect that is often underestimated.
Consider a typical case: a production line with 90% availability, 85% performance and 95% quality. Individually, these figures may seem satisfactory. However, the overall OEE drops to around 73%.
This gap highlights a key point : small losses across multiple dimensions can result in a significant overall performance drop.
OEE acts as a revealer. It does not simply indicate that performance is degraded, it shows that the degradation is distributed and cumulative.
To learn everything about calculating the OEE, we have written a complete article dedicated to this topic.

Interpreting OEE : going beyond the number
OEE only becomes meaningful when properly analyzed.
Two production lines with the same OEE level may face completely different challenges. In one case, losses may be driven by frequent breakdowns. In another, they may stem from reduced operating speed or high scrap rates.
Without this level of analysis, corrective actions may be misdirected.
The goal is not only to measure OEE, but to understand precisely what is driving losses, by distinguishing between availability, performance and quality issues.
The real causes behind OEE losses
In industrial reality, losses are neither abstract nor theoretical. They are rooted in very concrete, often recurring situations.
Unplanned downtime impacting availability
Breakdowns remain one of the main sources of performance loss. They rarely occur suddenly — most are preceded by early warning signs.
On mechanical equipment, progressive wear or misalignment may generate abnormal vibrations. Without monitoring tools, these signals remain undetected until failure occurs.
In such cases, production loss extends beyond repair time. Restart phases, adjustments and potential quality issues all contribute to additional inefficiencies.
Implementing vibration monitoring helps detect these deviations early and schedule maintenance proactively.
Hidden performance losses
Not all losses result in full stops. A significant portion of OEE degradation comes from performance losses that are harder to detect.
A machine may run continuously while producing below its nominal capacity. Micro-stops, operator adjustments and flow imbalances are rarely measured accurately.
Over a full day, these inefficiencies can represent a substantial loss of production time.
Production order tracking makes it possible to compare actual output with expected performance and highlight these discrepancies.
Quality issues directly impacting efficiency
Quality losses are often analyzed separately, yet they directly affect OEE.
Process drift, incorrect settings or changing production conditions can lead to defects that are not immediately identified.
By structuring traceability, it becomes possible to link defects to specific conditions.
Digital production tracking (digital traveler sheets) helps provide this visibility.
Why OEE is still underutilized
Despite its relevance, OEE is often underexploited.
In many cases, data is still collected manually. Stop causes are approximate, micro-stops are not tracked, and information remains difficult to analyze.
The lack of real-time visibility also limits responsiveness. When OEE is analyzed only at the end of the day, corrective actions come too late.
Finally, data is often siloed across teams, making comprehensive analysis more complex.
Improving OEE : practical and measurable levers
Improving OEE requires shifting from observation to action.
Anticipating failures to improve availability
When maintenance is purely reactive, each failure directly impacts production.
By analyzing early signals, failures can be anticipated and interventions scheduled.
On critical equipment, this approach can eliminate unplanned downtime and stabilize production, often resulting in several OEE points gained.
Stabilizing production to reduce performance losses
Performance losses are often caused by flow imbalances or constant adjustments.
By making these issues visible, it becomes possible to address root causes: workflow organization, synchronization and supply management.
Line-side supply management helps reduce shortages and improve production continuity.
Controlling quality to secure useful output
High production volume does not guarantee efficiency if a significant share is non-compliant.
By structuring production data, it becomes possible to identify the factors influencing quality and correct deviations.
Detecting hidden drifts
Some anomalies are not visible in standard production metrics.
For example, abnormal energy consumption may indicate underlying issues.
Energy consumption monitoring helps detect such situations.
The role of data and IoT in leveraging OEE
The main barrier to improving OEE is not the lack of indicators, but the lack of reliable data to feed them.
In many industrial environments, part of the information still relies on manual entries or estimates. Stop causes are approximate, micro-stops are not tracked, and performance gaps are difficult to measure objectively.
In this context, OEE becomes an imperfect indicator, often questioned and rarely used to drive concrete action.
This is precisely where IoT solutions make a difference.
By automating the collection of field data, they provide continuous and consistent information : production cycles, downtime, operating drifts and energy consumption. This level of granularity fundamentally changes the way OEE can be used.
A stop is no longer simply observed; it is characterized. A performance loss is no longer estimated; it is measured. A drift is no longer endured; it is detected.
It is this ability to connect indicators to measured facts that turns OEE into a true management tool.
OEE and Industry 4.0 : towards continuous operational control
As industries undergo digital transformation, the way OEE is used is evolving.
Historically, it was calculated at the end of a shift or at the end of the day, then analyzed afterwards. This approach made it possible to identify trends, but it significantly limited the ability to act.
Today, with connected equipment and real-time data, OEE can be monitored continuously. Deviations become visible as they occur, rather than several hours later.
This changes the whole logic of performance management.
The goal is no longer simply to explain past performance, but to correct an ongoing drift. A slowdown can be detected immediately. An anomaly can be addressed before it has a lasting impact on production.
OEE therefore becomes an operational indicator, used directly on the shop floor rather than as a simple reporting tool.
What OEE level should you aim for in your industrial environment?
The question of what constitutes a “good OEE” comes up frequently, but it cannot be answered in absolute terms.
The expected level of performance depends heavily on the type of activity, the degree of automation, production variability and operational constraints.
That said, a few benchmarks can help put performance into perspective :
- below 60%, performance is generally considered low, with significant losses,
- between 60% and 75%, there is substantial room for improvement,
- between 75% and 85%, performance is under control in most industrial contexts,
- above 85%, processes are generally optimized and stable.
Beyond these thresholds, however, the key issue remains understanding the gaps.
An OEE of 80% may still conceal major drifts if they are not analyzed. Conversely, an OEE of 65% may be a solid starting point if it is well understood and improving.
The objective is therefore not simply to reach a target figure, but to rely on a robust indicator to guide improvement.
What tangible gains can be expected from improving OEE ?
Improving OEE is not a marginal optimization exercise. The impacts are direct and often rapid.
By reducing unplanned downtime, speed losses and production defects, it becomes possible to significantly increase useful output.
In many cases, recovering just a few OEE points allows more to be produced with the same equipment, creating an immediate profitability lever.
The benefits are not limited to output volumes. They also include :
- lower costs linked to breakdowns and emergency interventions,
- improved quality and reduced scrap,
- greater operational stability and more reliable lead times.
Over time, improving OEE helps strengthen the overall competitiveness of industrial operations.
Why IoT sensors are particularly well suited to OEE monitoring
Measuring OEE reliably requires accurate, real-time data that doesn't depend on manual input. This is exactly what industrial IoT sensors deliver with concrete advantages that remove the usual barriers to deployment.
Installation without production downtime
IoT sensors require no wiring, no electrical or mechanical modification to the machine. Mounting takes just a few minutes using a magnet, clamp, or industrial adhesive without stopping production. The manufacturer's warranty on the monitored equipment is fully preserved.
A solution compatible with your entire machine fleet
Whether the equipment is brand new or thirty years old, the same solution applies. IoT sensors operate independently of the manufacturer's protocol or existing field bus: no dependency on the original integrator, no compatibility constraints.
Multi-parameter data from a single measurement point
A multi-variable sensor can simultaneously transmit vibration, temperature, shock, and cycle count data. Several OEE indicators are fed from a single point of measurement without multiplying devices on the machine.
Real-time OEE, not an end-of-shift report
With continuous monitoring, micro-stoppages, speed drifts, and rejects are detected within minutes. OEE becomes a tool for immediate response, rather than a figure reviewed after the fact.
Objective, auditable data
Manual entry introduces bias: forgotten events, rounded figures, underreported breakdowns. IoT sensors produce a neutral, timestamped dataset that is fully exploitable for analysis and audits alike.
A progressive rollout with fast ROI
There's no need to launch a complex IT project to get started. Two or three pilot machines are enough to validate the approach and measure early gains, often within a matter of weeks. Deployment then scales machine by machine, according to operational priorities.
Energy autonomy and constraint-free deployment
Sensors run on battery (3 to 5 years) or via energy harvesting. No electrical wiring, no cable routing: ideal for hard-to-reach areas or constrained environments.
Conclusion : from reactive OEE to managed OEE
OEE is not just another metric to feed into a dashboard. It is a diagnostic tool: it shows where losses are hiding, how much they weigh on performance, and which lever to act on first.
But its value depends entirely on the quality of the data behind it. An OEE figure calculated from manual estimates remains a reporting indicator. An OEE figure fed by continuous field data becomes a decision-making tool.
This is where IoT comes in, not as an additional technology layer, but as the simplest and fastest way to move from approximate measurement to reliable measurement, without disrupting production.
Improving your OEE starts with deciding to actually measure it.